
Report card day can feel like opening a letter written in another language. Your kid hands you a printout covered in numbers, colored bars, and terms you haven’t seen since your own school days. Two numbers tend to cause the most confusion: the Scaled Score and the Percentile Rank. Both show up on the STAR assessment report, and both matter—but they tell you completely different things about your child’s academic standing.
Let’s break each one down so the next parent-teacher conference feels a lot less overwhelming.
Scaled Score: Your Child’s Personal Growth Ruler
A scaled score on the STAR test falls somewhere between 0 and 1,400. Think of it as a measuring tape that stretches across every grade level. A second-grader who scores 415 in the fall and then bumps up to 498 by spring has made real, measurable progress—even if both numbers look abstract on their own.
The beauty of the scaled score is that it’s consistent. Whether a student takes the test in September or March, the scale stays the same, which means parents and teachers can track forward movement without worrying about seasonal curve adjustments. It answers a straightforward question: is my child learning more than they knew last time?
Schools lean on this metric when they set individual reading goals through programs like Accelerated Reader. If a student’s scaled score in reading sits at the lower end of their grade-level benchmark, the teacher might assign book levels that gently push comprehension skills upward rather than throwing the student into titles that feel impossible.
Percentile Rank: Where Your Child Stands in the Crowd
If the scaled score is a personal ruler, the percentile rank is a group photo. It tells you how your child performed compared to other students across the country who took the same test at the same grade level. A percentile rank of 75 means your child scored higher than 75 percent of that comparison group—not that they answered 75 percent of questions correctly. That distinction trips up a lot of families.
Percentile ranks range from 1 to 99, and they’re the number that typically drives placement decisions. Districts often use them to decide which students qualify for gifted programs, which ones need targeted intervention support, and which kids are tracking right on grade level. A student sitting below the 25th percentile, for instance, may be flagged for additional small-group instruction during the school day.
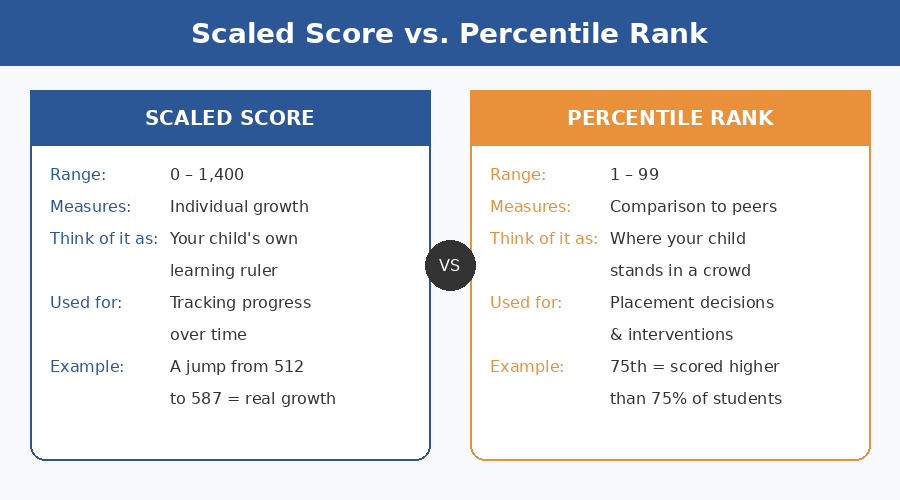
Image: Key differences between Scaled Score and Percentile Rank on the STAR assessment.
Why Both Numbers Matter Together
Here’s where parents sometimes get tripped up: a child can show impressive scaled-score growth and still have a middling percentile rank, or vice versa. That doesn’t mean something is wrong. It just means the two metrics are measuring different dimensions. Growth is personal; ranking is comparative. A student who jumps 80 points on the scaled score between testing windows is clearly learning—even if their percentile rank barely moves because other students also improved.
The smartest approach is to look at both numbers side by side. A rising scaled score paired with a stable or climbing percentile rank is a great sign. A flat or falling scaled score alongside a dropping percentile rank is a signal to sit down with the teacher and talk strategy sooner rather than later.
Turning Insight Into Action
Understanding the metrics is only half the battle; the other half is making sure your student is comfortable with the question types that drive these scores. The STAR test covers everything from foundational literacy to complex algebraic thinking, so familiarity with the format matters. Interactive tools like a STAR practice test let students work through the specific math and reading benchmarks for their grade level, so they walk into test day knowing what to expect instead of facing surprises.
Beyond practice, keep the conversation at home low-pressure. Kids pick up on test anxiety faster than most parents realize. Frame the STAR assessment as a check-in—a snapshot, not a verdict—and celebrate effort over numbers. When children feel safe enough to try hard without fearing judgment, their scores tend to reflect that confidence naturally.
At the end of the day, a scaled score and a percentile rank are just tools. They’re meant to help parents and educators make smarter decisions about support, pacing, and enrichment. Once you know how to read them, those confusing printouts start to feel a lot less like a foreign language—and a lot more like a roadmap.